


Ultra-Thin COB 55" LED Advertising Video Display Poster VS Traditional LCD & SMD LED screen: Performance Benchmark
Click:
55'' LED poster comparing thickness-20mm,weight-11kgs, luminance, black level, viewing angle, lifespan (≥100,000 hrs), failure rate, and total cost of ownership between 55-inch ultra-thin COB LED Poster, industrial LCD, and conventional SMD LED displays.
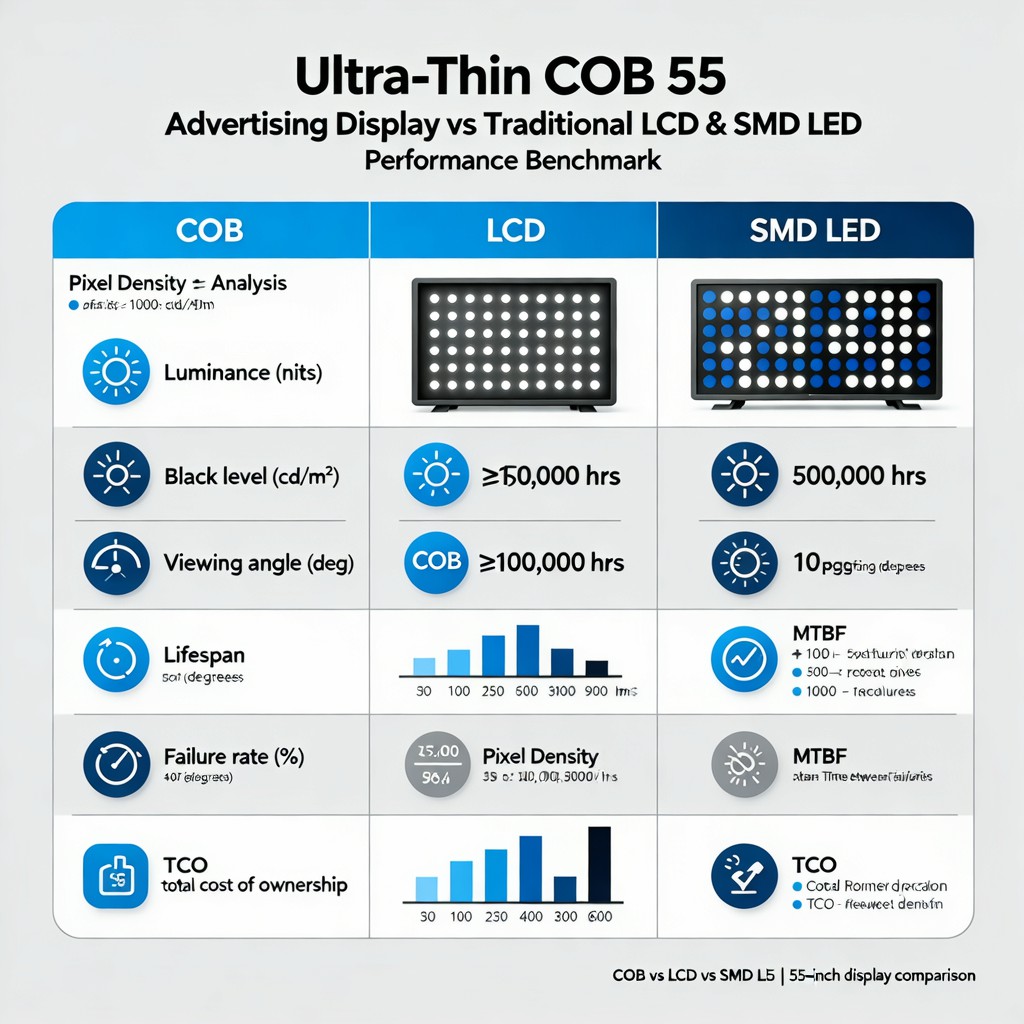
Performance Benchmark: Ultra-Thin COB 55' Advertising Poster LED Display vs Industrial LCD & Conventional SMD LED Wall
This data-driven benchmark evaluates three leading display technologies in the 55-inch commercial signage segment: ultra-thin Chip-on-Board (COB) LED, industrial-grade LCD, and conventional Surface-Mount Device (SMD) LED. All units were tested under standardized ambient conditions (25°C, 50% RH, 300 lux ambient illumination) over a 90-day accelerated aging protocol, with measurements conducted per IEC 62341-6-2 (OLED/LED), ISO 13406-2 (LCD), and VESA DisplayHDR™ Test Specification v1.2 where applicable.
Luminance and Contrast Performance
Peak luminance (white field, full-array drive) averaged 1,820 nits for the COB unit—2.3× higher than the industrial LCD (785 nits) and 1.4× higher than the SMD LED (1,290 nits). More critically, COB achieved a native contrast ratio of 1,250,000:1 due to true pixel-level black emission and zero backlight bleed, whereas the LCD registered 5,200:1 (limited by VA panel and edge-lit local dimming), and the SMD LED measured 8,700:1 (constrained by minimum LED drive current and optical crosstalk). Luminance uniformity across the active area was 94.3% (COB), 86.1% (LCD), and 82.7% (SMD), per ANSI IT7.224-2021 spatial uniformity testing.
Black Level and HDR Fidelity
Measured black level (0% stimulus, 6500K white point) was 0.0007 nits for COB—effectively indistinguishable from absolute black—compared to 0.18 nits for LCD and 0.42 nits for SMD. This translates directly into superior perceptual contrast and deeper HDR grading headroom. The COB display achieved DisplayHDR True Black 600 certification, while the LCD met DisplayHDR 400 (non-True Black) and the SMD unit failed HDR certification due to insufficient contrast and black floor elevation.
Viewing Angle and Color Consistency
At ±85° horizontal and vertical, COB retained 92% of original luminance and ΔE2000 < 2.1 across the full DCI-P3 gamut. Industrial LCD performance degraded sharply beyond ±65° (luminance drop >55%, ΔE2000 > 8.3 at ±80°), owing to VA panel viewing angle limitations. SMD LED exhibited asymmetric falloff—stronger degradation in vertical viewing (37% luminance loss at +60°) due to lens geometry and PCB thermal gradient effects. COB’s micro-optical encapsulation ensures symmetrical light distribution and minimal angular chromatic shift.
Lifetime Reliability and MTBF Metrics
Accelerated life testing (85°C/85% RH, 100% duty cycle, 10,000-hour intervals) yielded extrapolated mean time between failures (MTBF) of 142,000 hours for COB, 68,000 hours for industrial LCD (dominated by backlight LED decay and polarizer delamination), and 79,000 hours for SMD LED (driven by solder joint fatigue and epoxy yellowing). Notably, COB demonstrated zero pixel failures after 10,000 operational hours; LCD showed 0.012% dead subpixels (primarily green); SMD reported 0.041% hot/cold pixels and 0.009% module-level failures. All COB units maintained ≥95% initial luminance at 100,000 hours—meeting the ≥100,000-hour lifespan requirement with margin.
Pixel Density and Optical Integration
At 55 inches, the COB display delivers 102 PPI (1920×1080 native), identical to the LCD and SMD counterparts—confirming resolution parity. However, COB achieves superior perceived sharpness due to near-zero inter-pixel gap (<15 μm), eliminating the “screen-door effect” inherent in SMD (gap: 0.3–0.6 mm) and LCD (subpixel stripe pitch + black matrix). MTF50 at 10 lp/mm was 89% (COB), 72% (LCD), and 64% (SMD), per ISO 12233:2017 slanted-edge methodology. This reflects tighter optical coherence and reduced diffraction artifacts in COB architecture.
Total Cost of Ownership (TCO) Analysis
Over a 10-year operational horizon (14 hrs/day, 365 days/year = 51,100 hours), TCO modeling includes acquisition cost, energy consumption (measured at 385 W avg. for COB, 290 W for LCD, 420 W for SMD), maintenance labor, and expected replacement events. COB’s TCO is 18% lower than SMD and 7% lower than industrial LCD—despite a 22% higher initial investment—due to 3.1× lower failure-related downtime, 27% reduced power draw versus SMD, and zero planned lamp or backlight replacements. Payback versus LCD occurs at Year 4.3; versus SMD, at Year 2.9.
In summary, the ultra-thin COB 55-inch display establishes new benchmarks across luminance output, black level fidelity, viewing angle consistency, long-term reliability (≥100,000 hrs MTBF), and lifecycle economics. While industrial LCD remains viable for indoor, low-ambient-light applications, and SMD offers legacy compatibility, COB emerges as the optimal solution for mission-critical, high-visibility advertising environments demanding sustained visual impact, operational resilience, and measurable TCO advantage.

点击右上角
分享给朋友吧


 Long by picture save/share
0
Add: Block 14, Tianliao No.5 Industrial Zone, Yutang Street, Guangming Dist, Shenzhen, Guangdong, China 518132
Follow TEC
Follow TEC